Simple linear diagram displaying wind direction data from an influxdb server using flux

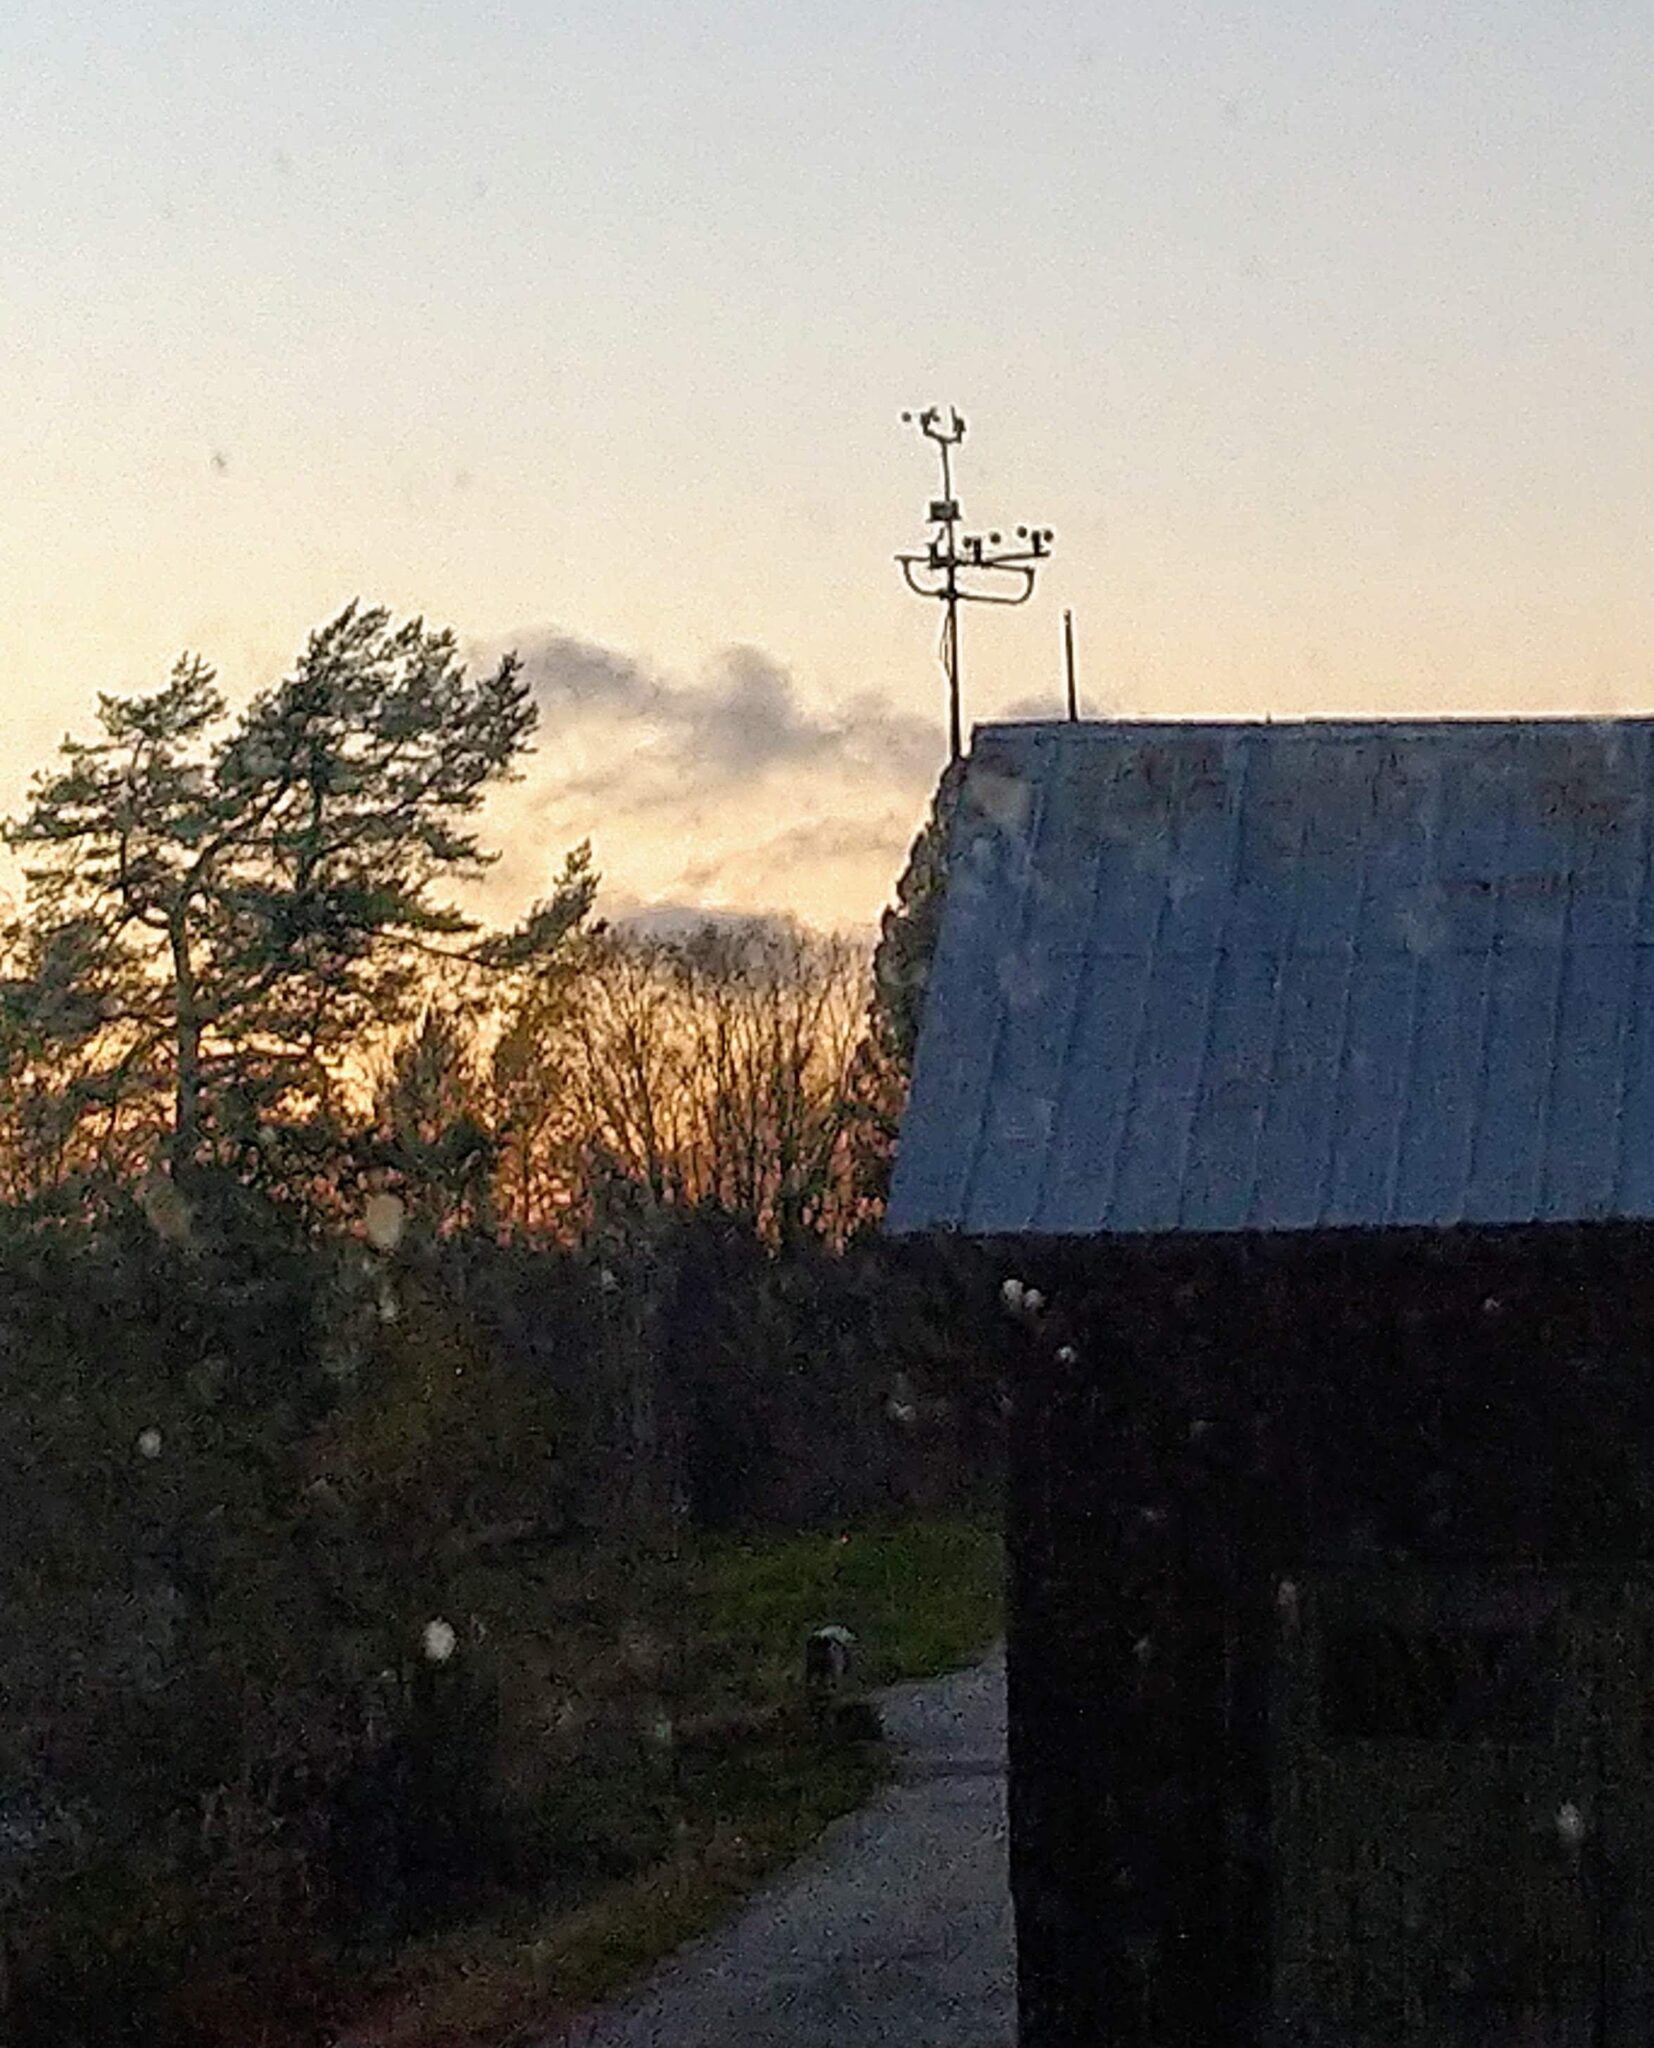
This diagram (using charts from charts.js) displays real time wind direction data which is fetched from a local server here at the Grodans Paradis AB office. The wind direction in this sample comes from a Weather Meter Kit bought from Sparc Fun. The displayed graphics is the direction for the last hour.
The data from the wind vane (a voltage) is collected by a CAN4VSCP Vilnius module and sent over a CAN bus to a VSCP Daemon. This daemon export the voltage reading to a MQTT broker and from the MQTT broker a node-red flow read the value and transform it to a wind direction. This wind direction is feed back to the MQTT broker and is also written to a influxdb bucket.
You can look at the raw wind vane voltage events by subscribing to the VSCP demo broker at topic vscp/25:00:00:00:00:00:00:00:00:00:00:00:05:01:00:03/15/2/#
mosquitto_sub -h demo.vscp.org -u vscp -P secret -t vscp/25:00:00:00:00:00:00:00:00:00:00:00:05:01:00:03/3/15/2/0
You can look at the wind vane direction events by subscribing to the VSCP demo broker at topic vscp/25:00:00:00:00:00:00:00:00:00:00:00:05:00:01:04/4/1040/30/0/#
mosquitto_sub -h demo.vscp.org -u vscp -P secret -t vscp/25:00:00:00:00:00:00:00:00:00:00:00:05:00:01:04/4/1040/30
Update the page with the F5 key to get the latest reading.
Source for the demo is available here
Copyright © 2000-2022 Ake Hedman, the VSCP Project